

EPU has risen from a 2016-2024 level of 136 to a 2025 level of 430. Ferrara and Geurin (2018) find that a 90 pt increase results in a bit less than 2% decline in employment at the one year horizon.
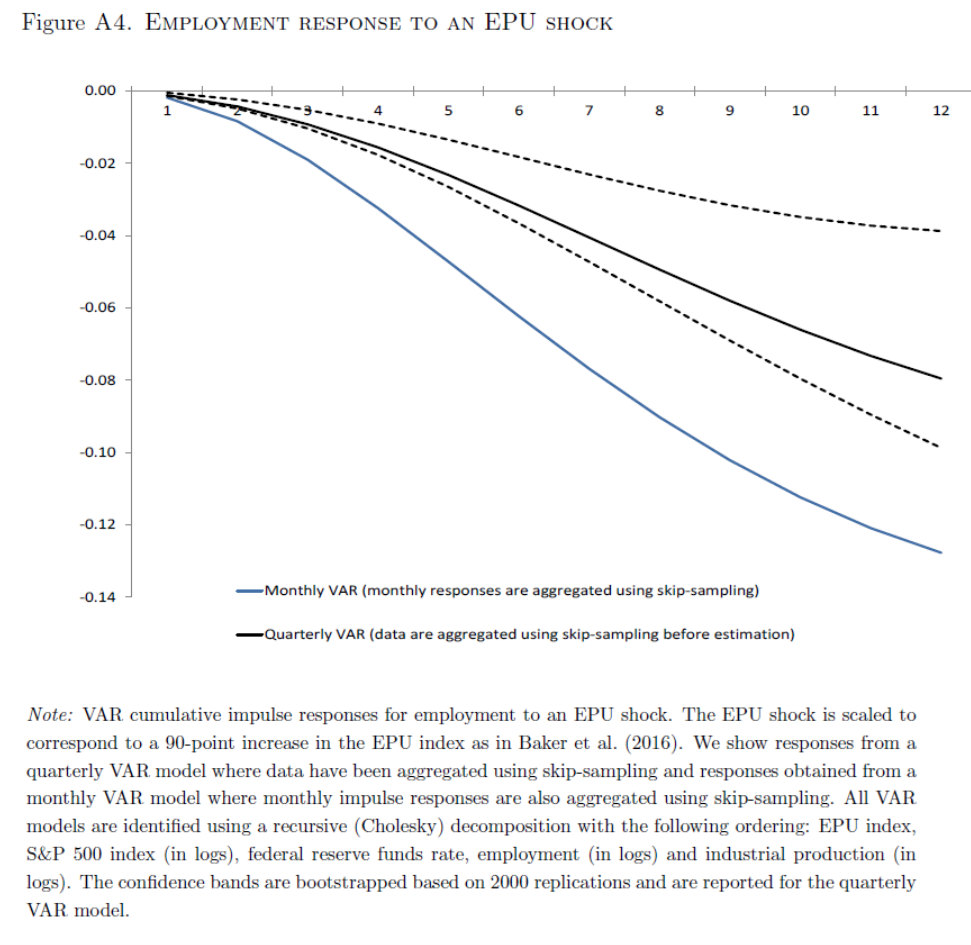
Assuming linearity in the impacts, this means that at a one year horizon, employment might be down by as much as 6 ppts. This is shown in the figure below.
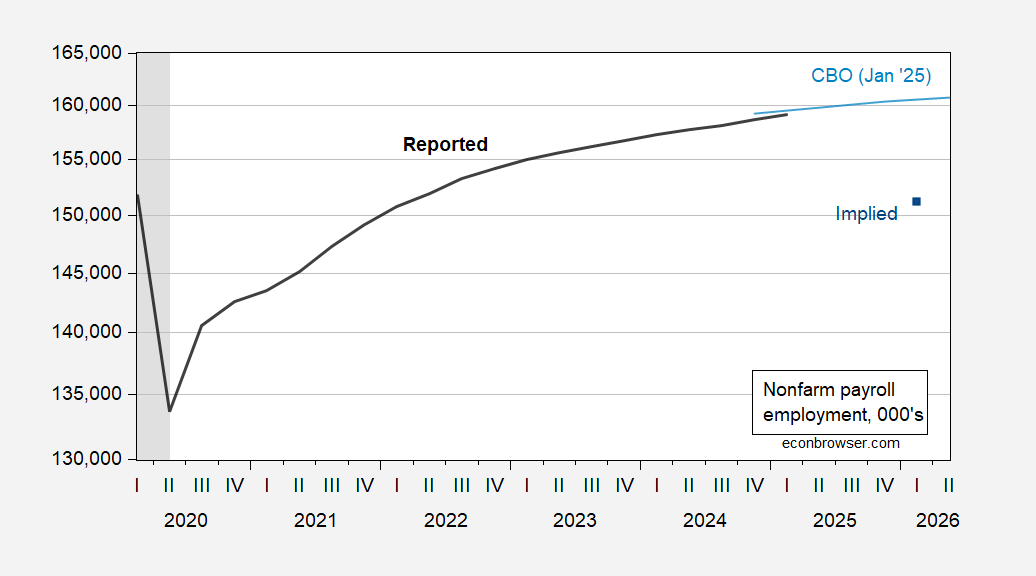
Figure 1: Nonfarm payroll employment (black), CBO January 2025 baseline (light blue), and implied by 3.3 std deviation shock to EPU (blue square), all in 000’s, s.a. Source BEA, CBO (January 2025), and author’s calculations.
Note that this calculation is based upon linearity-in-effects. There have been no comparable increases in EPU, save the Covid-19 associated spike, and the Q2 value is yet higher. It could be that after a certain level, EPU does not have any further negative impact on employment.


