

Goldman Sachs has reduced the probability of recession in the next 12 months to 30%, from 35%, and earlier 45% (Reuters). It’s important to note that these projections are conditional on the path of future policies — which in these times are less clear than ever.
Here’s my math.
The current quota set for ICE deportations/removals is 3000/day. If that pace is achieved (which will almost assuredly scoop up more than just criminals), then after one year, about 1.1 million individuals will be removed.
McKibben, Hogan and Noland (2024) provided simulation estimates for 1.3 million removed.
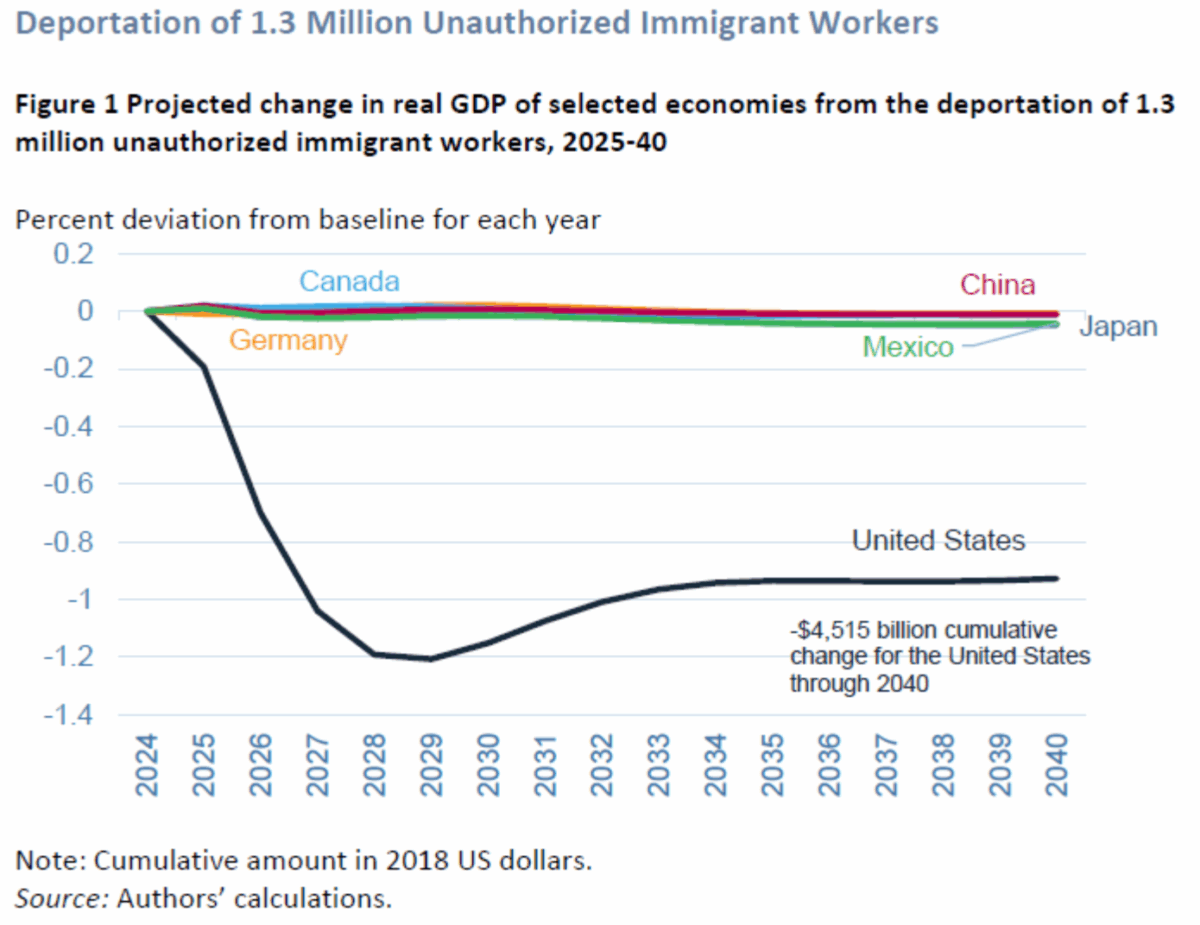
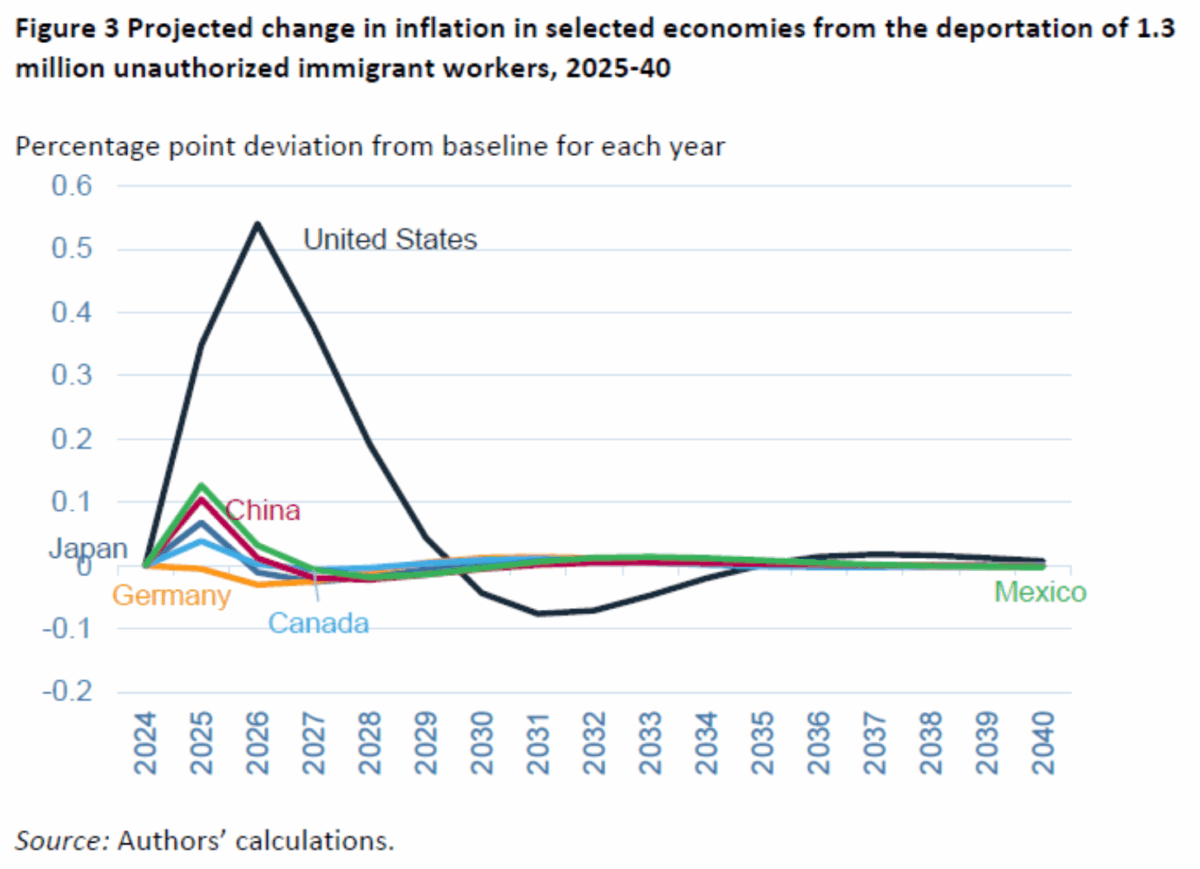
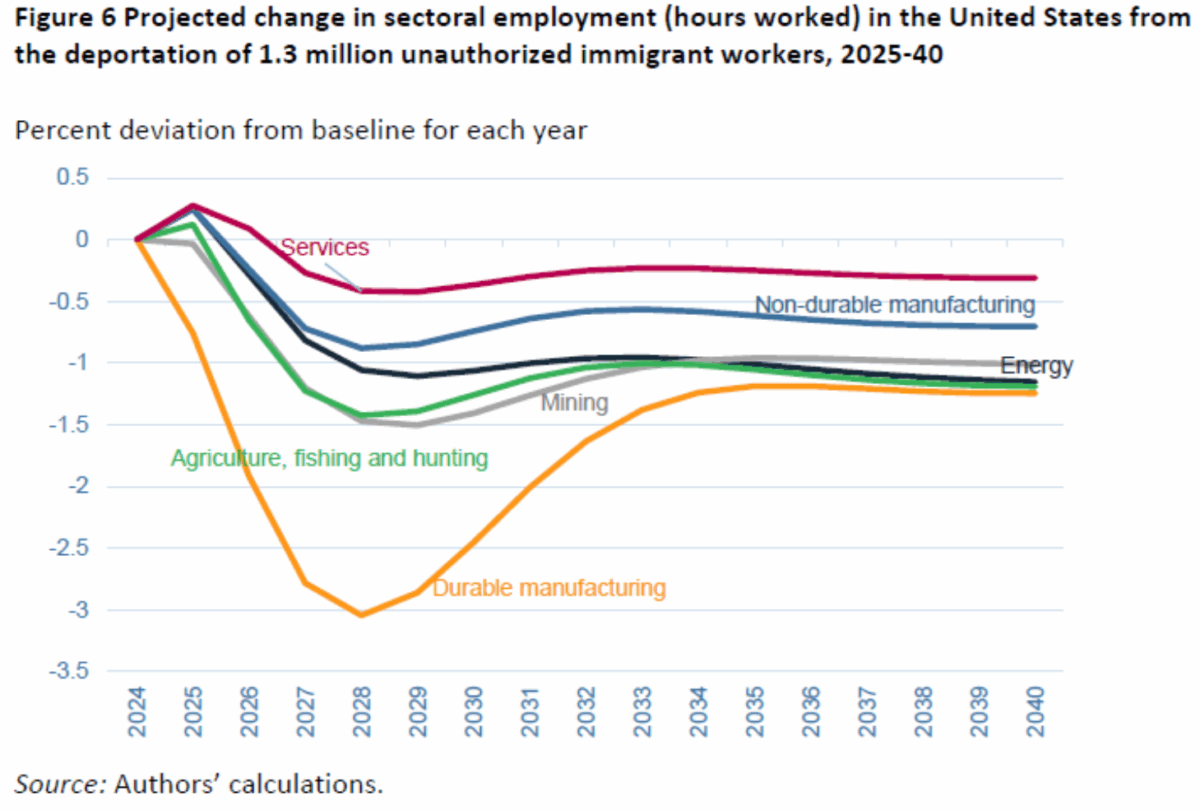
The 2026 impact looks rather modest — around 0.6 ppt deviation from baseline. Note that the estimates are for deportations/removals alone. They do not include tariffs. Assuming the current pause conditions hold, so universal 10% tariffs, with 45% or so on China (including past tariffs) hold, a lower bound estimate from trade policies is -0.3 ppts in 2026 — assuming no retaliation. With retaliation, its -0.9 ppts.
One point is that none of these estimates incorporate the effect of policy uncertainty. However, we know that policy uncertainty is important — especially since policy uncertainty as measured by EPU is now about 4 times what is was pre-Trump. Assuming linearity, Ferrara and Guerin (2018) estimates suggest unemployment will be about 2 ppt less than it otherwise would be. This implies roughly a 1.5 ppts lower GDP relative to counterfactual.
Add 0.6 to 0.9, and you get 1.5 ppts. But add policy uncertainty (which Trump seems to be trying to maximize), and that’s 1.5 ppts added to 1.5 ppts to sum to 3 ppts. If baseline growth was estimated to be 2.3 ppts (I’m using CBO January 2025 projection), then GDP growth going into 2026 will be negative.
So, I’m doing a conditional forecast here: deportations/removals hit close to 2.1 millions, tariffs are at least 10% universal, with retaliation, and policy uncertainty percolates through the economy as estimated using historical events. One point is policy uncertainty has not risen to these levels in recent times, aside from the once-a-century Covid Pandemic.
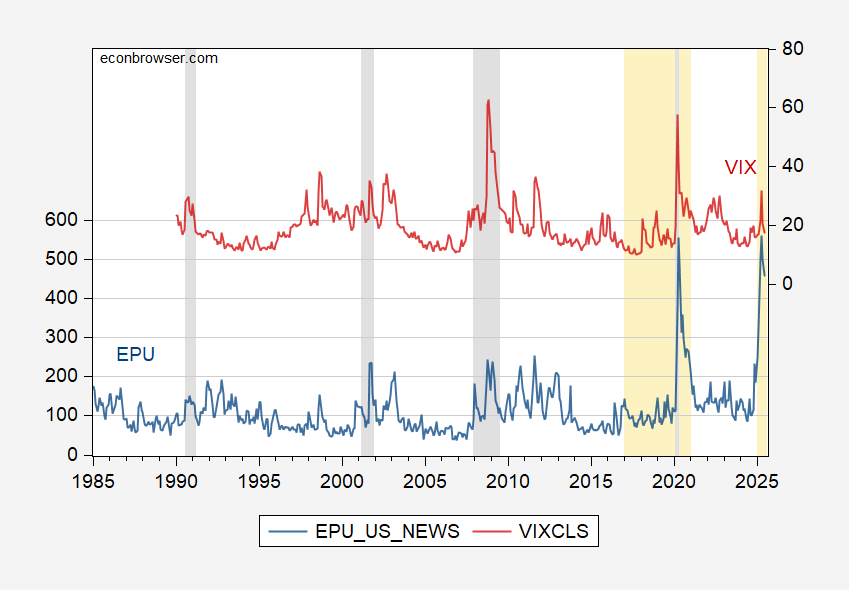
Figure 1: EPU (blue, left scale), VIX (red, right scale). NBER defined peak-to-trough recession dates shaded gray. Light orange denotes Trump administrations. Source: policyuncertainty.com, CBOE via FRED, NBER.

Figure 2: EPU-trade (blue, left scale), TPU (red, right scale). NBER defined peak-to-trough recession dates shaded gray. Light orange denotes Trump administrations. Source: policyuncertainty.com, Iacoviello et al., NBER.
Would I still rely on one-year-ahead recession forecasts from term spreads for the next six months? No, because the policy changes implemented in the past five months have been sufficiently unexpected enough (at least by the market), that the usual mechanism is unlikely to operate.


