

Goldman Sachs puts Q1 growth at 0.1% q/q AR close to adjusted GDPNow, while NY Fed indicates 2.58%. The St. Louis Fed “news” index stands at 2.83%.
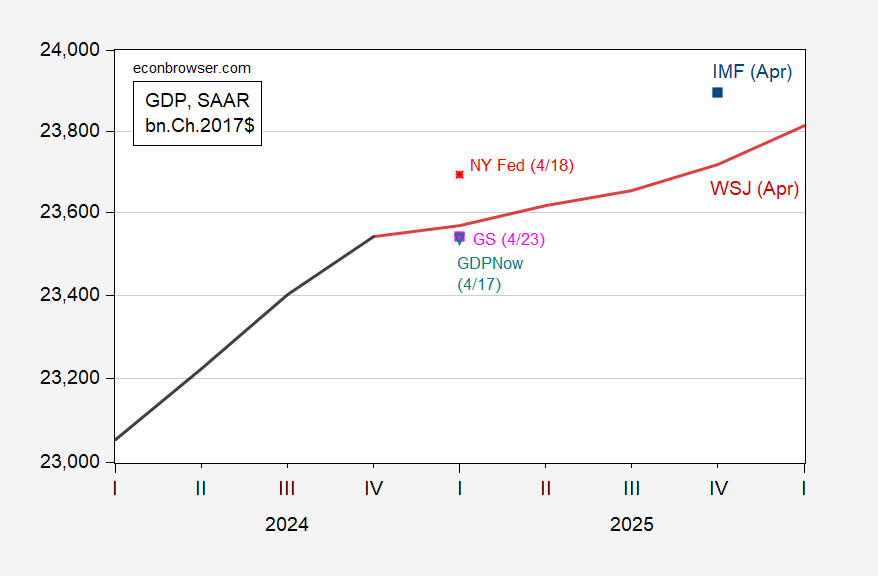
Figure 1: GDP (bold black), GDPNow of 4/17 (teal open inverted triangle), NY Fed of 4/18 (red *), Goldman Sachs tracking of 4/23 (pink square), IMF WEO of April (blue square), WSJ April survey mean (bold red line), all in bn.Ch.2017$ SAAR. Source: BEA 2024Q4 3rd release, Atlanta, NY Fed, IMF WEO, WSJ economic survey, and author’s calculations.
GS and GDPNow stand apart from NY Fed and St. Louis Fed nowcasts. I don’t have a complete explanation why this is the case, although I suspect that it has to do with the top down approach of the NY Fed nowcast having a hard time accounting for the import surge caused by the front-running of tariffs. Jim Hamilton gave a rundown of the basic differences between the NY Fed and Atlanta Fed nowcasts here. The NY Fed is a top down nowcast, while the Atlanta Fed is a bottom up nowcast, building up from NIPA components (consumption, investment components, government spending, exports, imports, inventory accumulation).
Here’s the gold-adjusted NIPA imports. Notice the jump in nowcasted 2025Q1.
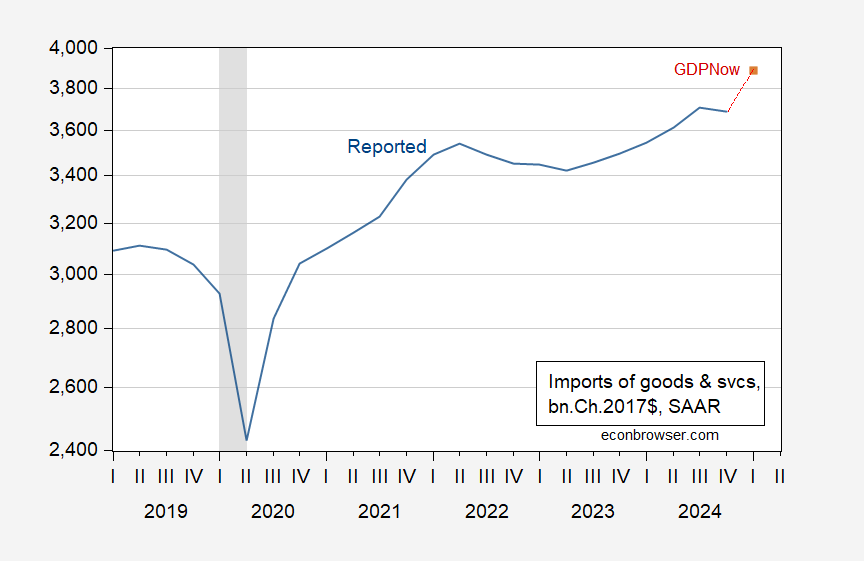
Figure 1: Imports of goods and services (blue), and GDPNow (4/17) implied imports (red square), all in bn.Ch.2017$ SAAR. NBER defined peak-to-trough recession dates shaded gray. Source: BEA, Atlanta Fed, NBER and author’s calculations.
Presumably, some of the spike in imports will be reversed in Q2, pulling up GDP in that quarter. However, other components of GDP (say investment) might take a dive, so in the end, it may be lackluster growth.


 Credibility Lost? Bordo-Siklos 5 Year")


