

+139K vs +126K Bloomberg consensus; private NFP +140K vs +110K. Manufacturing employment down 8K vs -1K consensus. But durable manufacturing production workers down -12K.
Overall, business cycle indicators followed by the NBER’s Business Cycle Dating Committee seem fairly solid
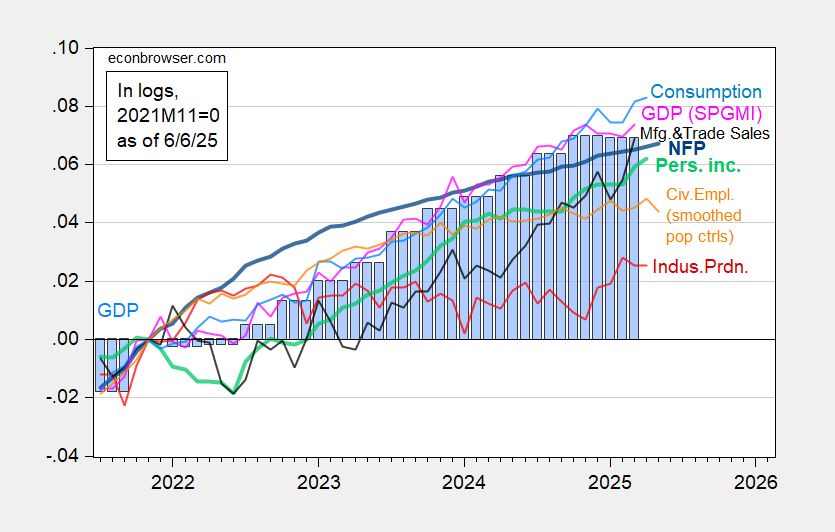
Figure 1: Nonfarm Payroll incl benchmark revision employment from CES (bold blue), civilian employment using smoothed population controls (orange), industrial production (red), personal income excluding current transfers in Ch.2017$ (bold light green), manufacturing and trade sales in Ch.2017$ (black), consumption in Ch.2017$ (light blue), and monthly GDP in Ch.2017$ (pink), GDP (blue bars), all log normalized to 2021M11=0. 2025Q1 GDP is second release. Source: BLS via FRED, Federal Reserve, BEA, S&P Global Market Insights (nee Macroeconomic Advisers, IHS Markit) (5/1/2025 release), and author’s calculations.
Civilian employment is down, but given the relatively low precision of this series, low weight should be placed on it.
On the other hand, NFP growth has been revised down in previous months. Here’s a picture of various measures of this indicator.
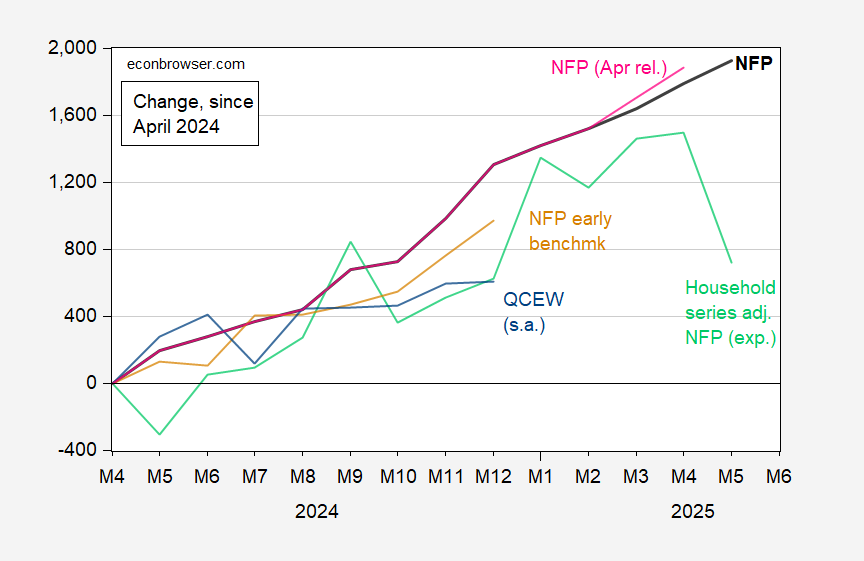
Figure 2: Change since 2024M04, in Nonfarm Payroll Employment (bold black), April NFP (pink), household series adjusted to NFP concept (light green), NFP early benchmark (tan), and QCEW seasonally adjusted by author over 2021M01-2024M12 using X13 (blue), all in 000’s.
Two things to remark on: both the Philadelphia Fed’s early benchmark and QCEW suggest slower growth (QCEW more so; the early benchmark is based on QCEW figures through Q3, so the shown QCEW series is more up-to-date).
What do we know about the manufacturing sector, which we anticipate will be heavily affected by tariffs and tariff uncertainty?
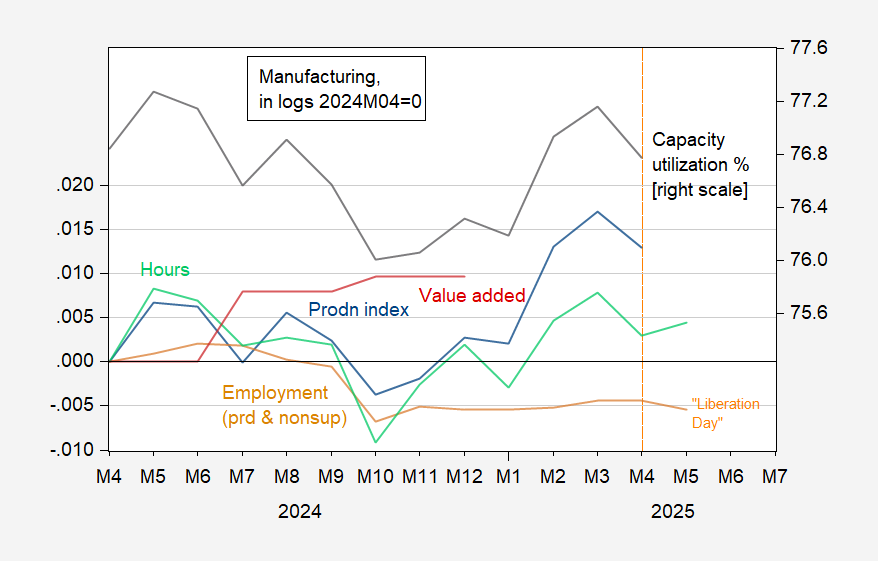
Figure 3: Manufacturing production (blue), value added in 2017$ (red), production and nonsupervisory worker employment (tan), hours (light green) all in logs, 2024M04=0; and capacity utilization (NAICS), % (black, right scale). Aggregate hours of production workers calculated by multiplying average weekly hours by employees. Source: Federal Reserve, BEA, BLS, and author’s calculations.
The impact of “Liberation Day” is not too apparent in Figure 3. Focus on employment (where we have May data) and on durables manufacturing, as in Figure 4.
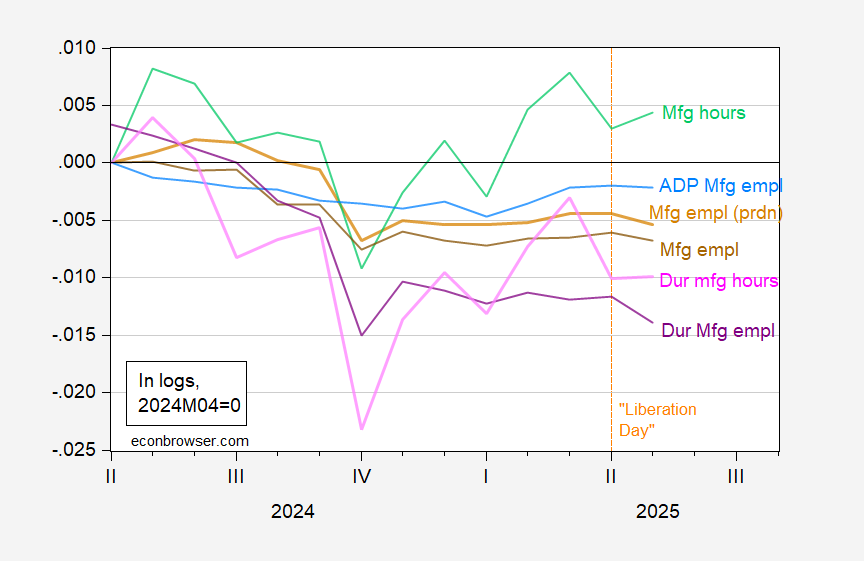
Figure 4: BLS manufacturing employment (brown), ADP manufacturing employment (light blue), BLS manufacturing employment, production and nonsupervisory workers (tan), hours (light green), BLS durable manufacturing employment, production and nonsupervisory workers (purple), and durable nonmanufacturing hours (pink), all in logs, 2024M04=0. Aggregate hours of production workers calculated by multiplying average weekly hours by employees. Source: BLS, ADP, and author’s calculations.


