

More accurately, nowcasted using inbound container traffic. Two thirds of Chinese imports (by value) comes by sea freight. And sea freight from China doesn’t seem to be rebounding; from Torsten Slok:
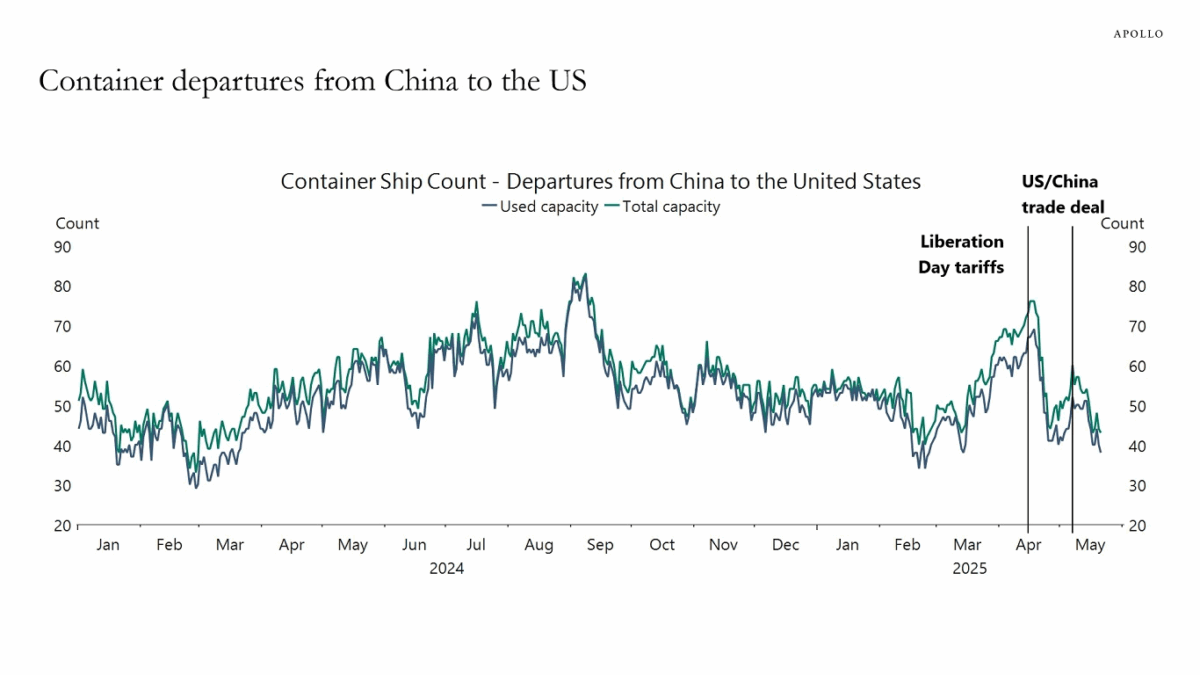
Source: Slok, May 25, 2025.
How are TEUs correlated with imports? Here’s total LA/Long Beach inbound TEUs and Chinese imports (deflated into 2003M12$)
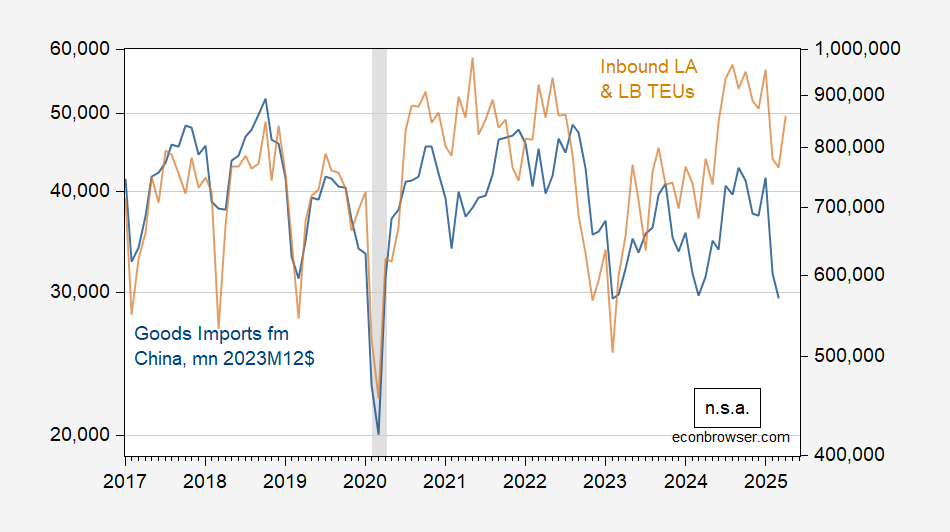
Figure 1: Goods imports from China, mn 2003M12$, n.s.a (blue, left log scale), filled inbound TEUs to LA and Long Beach ports, n.s.a. (tan, right log scale). Nominal series deflated into real using deflator for imports of Chinese goods. NBER peak-to-trough recession dates shaded gray. Source: BEA , BLS via FRED, Ports of LA, Long Beach, NBER and author’s calculations.
Can we predict April imports from China based on inbound TEU’s? Over the 2022M01-2025M03 period, I estimate in log first differences (using not seasonally adjusted data):
Δimpcht = -0.013 + 0.239 Δteu_LAt + 0.303Δteu_LBt + ut
Adj-R2 = 0.26, SER = 0.086, DW = 2.37, NObs = 39. Bold denotes significant at 10% msl, using Newey-West s.e.
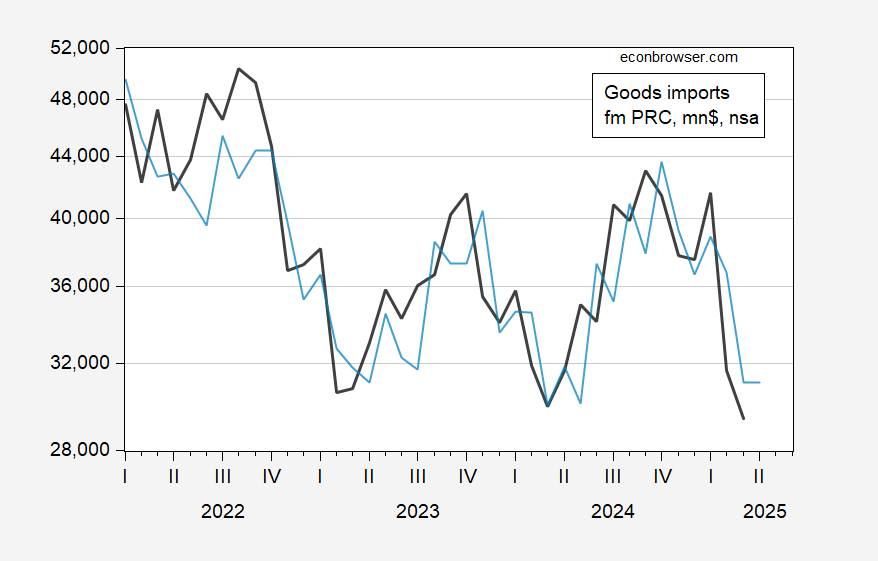
Figure 2: Imports from China (black), and predicted imports using indicated equation (light blue), both in mn.2003M12$. Source: BEA, BLS via FRED, and author’s calculations.
Should we expect a rebound now that there’s been an apparent pause in escalation in the trade war with China. The first figure provided by Slok suggests no. And given the incredibly fickle nature of Trump 2.0 trade policy, it’s understandable why this is the case.
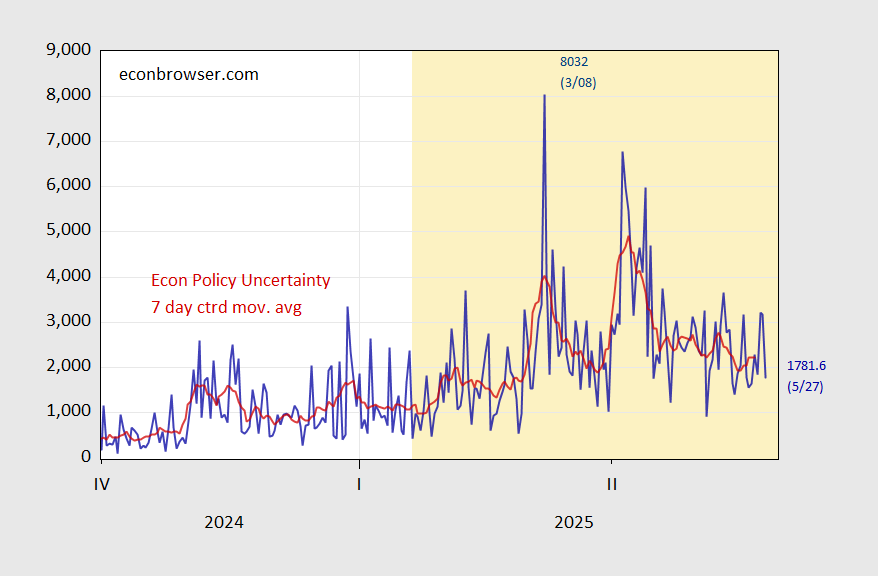
Figure 3: EPU – trade category (blue), 7-day centered moving average (red). Light orange shading indicates second Trump 2.0 administration. Source: policyuncertainty.com.
For more on nowcasting trade using (in part) container traffic, see this blogpost.


