

CRFB spreadsheet here for now; to be updated.
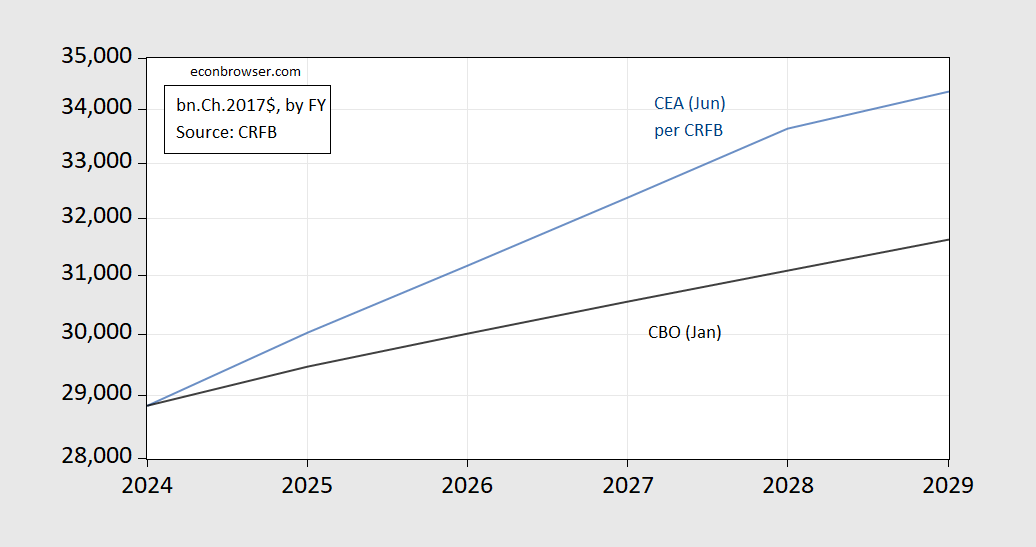
Figure 1: CBO GDP projection from January 2025 (black), implied CEA June forecast (blue), both in bn.Ch.2017$, by fiscal year. Source: CRFB.
A quarterly look at the CEA implied forecast calculated by me here.
The difference between the two seems to be attributable to the faster growth CRFB attributed to the CEA’s near term growth, than mine where I distributed evenly growth.


