

Personal income, consumption both down in May, with today’s release. Industrial production, civilian employment in NFP concept down from previous releases. Monthly GDP from SPGMI and manufacturing and trade industry sales down in April…it’s reasonable to ask whether this is all signaling something.
First up, indicators followed by the NBER Business Cycle Dating Committee (BCDC). The BCDC places primary emphasis on the employment and income series.
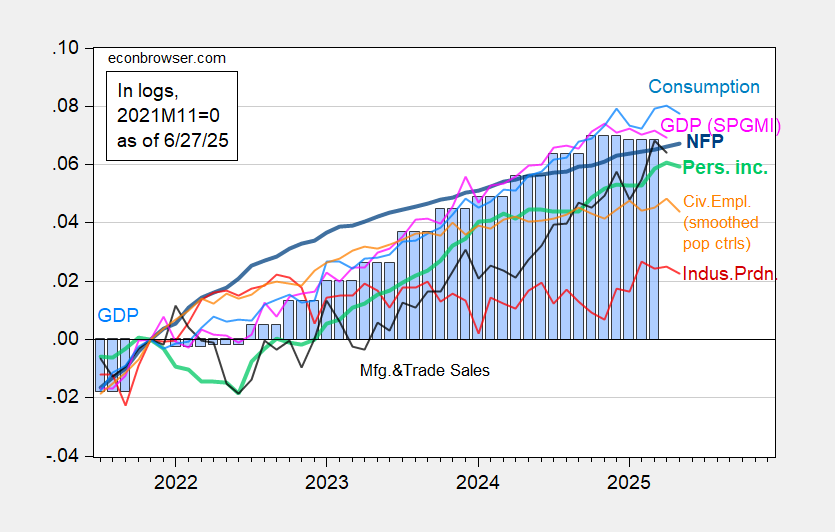
Figure 1: Nonfarm Payroll incl benchmark revision employment from CES (bold blue), civilian employment using smoothed population controls (orange), industrial production (red), personal income excluding current transfers in Ch.2017$ (bold light green), manufacturing and trade sales in Ch.2017$ (black), consumption in Ch.2017$ (light blue), and monthly GDP in Ch.2017$ (pink), GDP (blue bars), all log normalized to 2021M11=0. 2025Q1 GDP is third release. Source: BLS via FRED, Federal Reserve, BEA, S&P Global Market Insights (nee Macroeconomic Advisers, IHS Markit) (6/2/2025 release), and author’s calculations.
Total nominal personal income at -0.4% m/m was below Bloomberg consensus increase +0.3, while nominal consumption spending was below (-0.1% m/m vs. +0.1%)
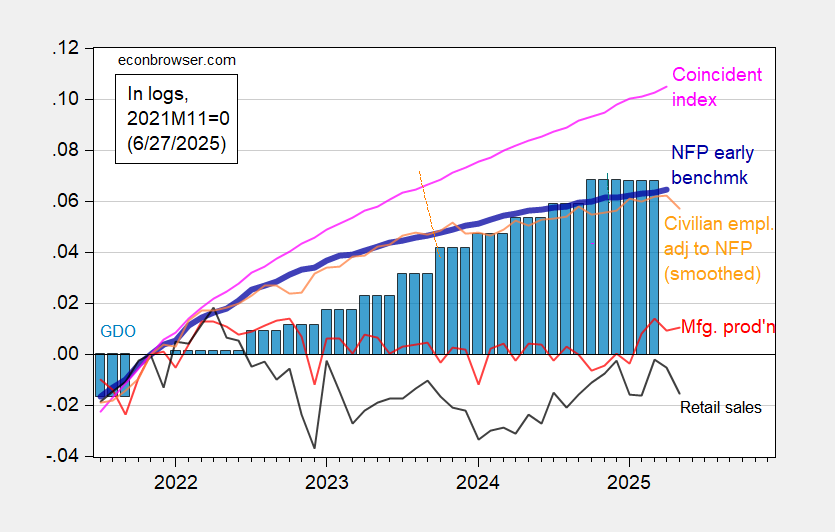
Figure 2: Preliminary Nonfarm Payroll early benchmark (NFP) (bold blue), civilian employment adjusted to NFP concept, with smoothed population controls (orange), manufacturing production (red), real retail sales (black), and coincident index in Ch.2017$ (pink), GDO (blue bars), all log normalized to 2021M11=0. Source: Philadelphia Fed [1], Philadelphia Fed [2], Federal Reserve via FRED, BEA 2025Q1 third release, and author’s calculations.
In general, I put much heavier weight on the CES vs. CPS measures of employment. However, if you’re a believer that the CPS series signals recessions earlier than the CES, well, time to start worrying (there’s actually only mixed evidence in support of this view, using real-time data, see this post).
The falloff in (chained CPI deflated) retail sales is also suggestive of a tiring consumer, which would not be surprising given the relatively low levels of consumer sentiment.
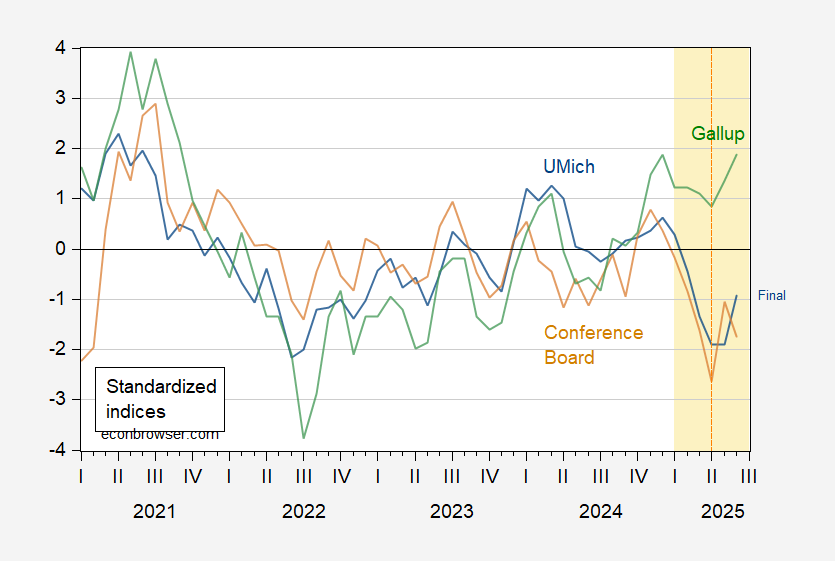
Figure 3: U.Michigan Economic Sentiment (blue), Conference Board Confidence Index (brown), Gallup Confidence (green), all demeaned and divided by standard deviation 2021M01-2025m02. Dashed line at “Liberation Day”. Source: UMichigan, Gallup, Conference Board, and author’s calculations.


 Credibility Lost? Bordo-Siklos 5 Year")


