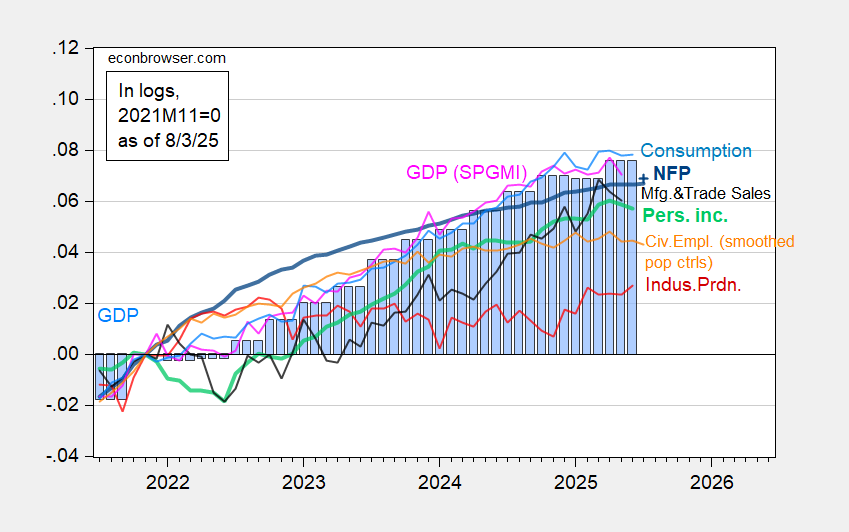
Maybe, maybe not. With the employment release of Friday, here’re the pictures, first of NBER’s BCDC key indicators, and second of alternative indicators (recalling all the most recent data will be revised):
Figure 1: Nonfarm Payroll from CES (bold blue), implied NFP Bloomberg consensus as of 7/1 (blue +), civilian employment with smoothed population controls (orange), industrial production (red), personal income excluding current transfers in Ch.2017$ (bold light green), manufacturing and trade sales in Ch.2017$ (black), consumption in Ch.2017$ (light blue), and monthly GDP in Ch.2017$ (pink), GDP (blue bars), all log normalized to 2021M11=0. Source: BLS via FRED, Federal Reserve, BEA 2025Q2 advance release, S&P Global Market Insights (nee Macroeconomic Advisers, IHS Markit) (7/1/2025 release), and author’s calculations.
The big NFP miss, usually not visible, is readily apparent in this graph. That’s because of the revisions to previous months. While small relative to annual benchmark revisions, they are noticeable here. Big downward revisions, if memory serves me correctly, are seen around turning points. If one were looking for succor in the household survey, one won’t find it. The civilian employment series has been flat for months. And if one believes trends in the household employment series presage recessions at an earlier point than the establishment series, then start worrying.
Just to recap, consumption, personal income and monthly GDP are all below recent peaks.
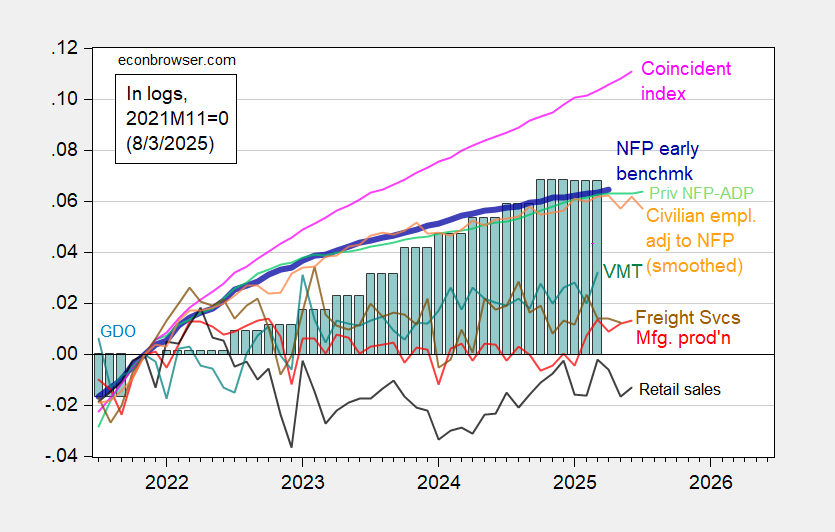
Here are some alternative monthly indicators (drawn on same vertical scale as Figure 2):
Figure 2: Implied Nonfarm Payroll early benchmark (NFP) (bold blue), civilian employment adjusted to nonfarm payroll concept, with smoothed population controls (orange), manufacturing production (red), vehicle miles traveled (teal), real retail sales (black), and coincident index in Ch.2017$ (pink), BTS Freight Services Index (brown), GDO (blue bars), all log normalized to 2021M11=0. Retail sales deflated by chained CPI, seasonally Source: Philadelphia Fed [1], Philadelphia Fed [2], Federal Reserve via FRED, BEA 2025Q2 advance release, DoT BTS, and author’s calculations.
As discussed here, Mr. Trump’s assertions of rigged data are wildly unjustified, given private NFP as measured by ADP shows the same pattern as the current BLS private NFP series, but on a lower trajectory. If anything, the pre-revision series was less plausible, given the ADP series trajectory.
Retail sales, civilian employment adjusted to NFP concept, and manufacturing production are all below recent peak (albeit insignificantly in the latter case). The coincident index is the only series that is unambiguously rising. The coincident index is based labor market data, so as long as NFP is rising, it’ll rise. With revised employment data, the next iteration of of the coincident indicator will look noticeably different.
So until the establishment series trend downwards, I reserve judgment.


