

Mr. Moore continues his reign of (economic) errors, now tackling the CBO’s (and JCT’s) record on predictions, in “Save us from the CBO”
…Mr. Hassett uncovered an issue that has swerved Washington into bad policy for decades.
The most powerful forces on Capitol Hill aren’t the House speaker and Senate majority leader, they’re the CBO and JCT. These two unelected bodies forecast how legislation could change spending and revenue over the next decade. Too often, these predictions are wildly off base.
Before turning to the substance of his allegations, it’s useful to remember that Mr. Moore (he doesn’t have a Ph.D., I suspect he’s never been to the modest office of the CBO) has made the following assertions.
Stephen Moore Lies and Lies and Lies (and Hence Belongs in the Trump NEC)
Stephen Moore: “When It Comes To Electric Power, Coal Is No. 1”
Stephen Moore’s Analysis of Income Taxes and Employment Growth
Homosocial Reproduction and Economic Policy Formulation in the White House
State Employment Trends: Does a Low Tax/Right-to-Work/Low Minimum Wage Regime Correlate to Growth?
Back to projections. As far as I know, I have a JCT (not CBO, although reported in a CBO document) estimate of deviations from baseline:
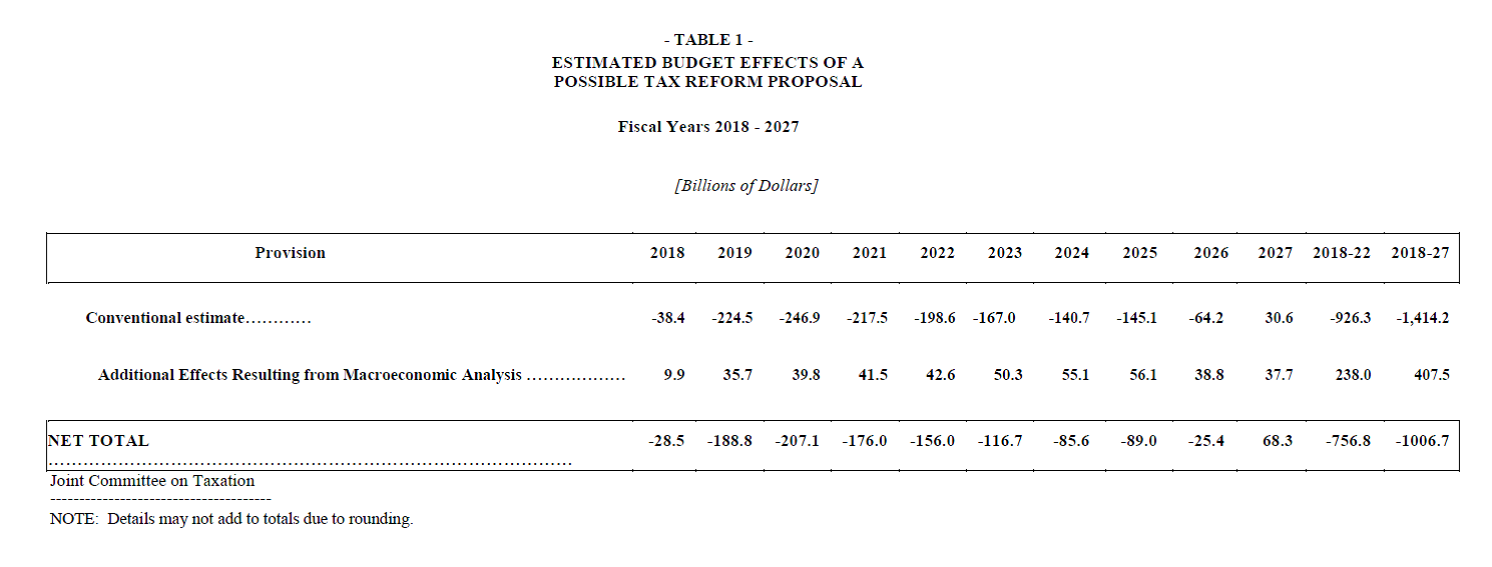
Source: JCT (November 30, 2017).
I don’t know in what way Mr. Moore knows CBO’s estimate of “fiscal effects” is understated, as he doesn’t cite a study, does not show a calculation, and does not indicate whether the underestimate is over a 5 year or 10 year horizon. There is an evaluation of Administration vs. CBO revenue projections, which did not show a serious deficiency of the CBO revenue estimates in FY2018-2019. Hence, given Mr. Moore’s penchant for data errors, I would be wary of taking his assertions at face value.
I do know that CBO projections of nominal and real GDP and inflation are comparable to those of the Blue Chip forecasts, and slightly less than that of administration, over decades (see this 2023 CBO assessment).
Here’s CBO vs. Trump administration (incorporating JCTA).
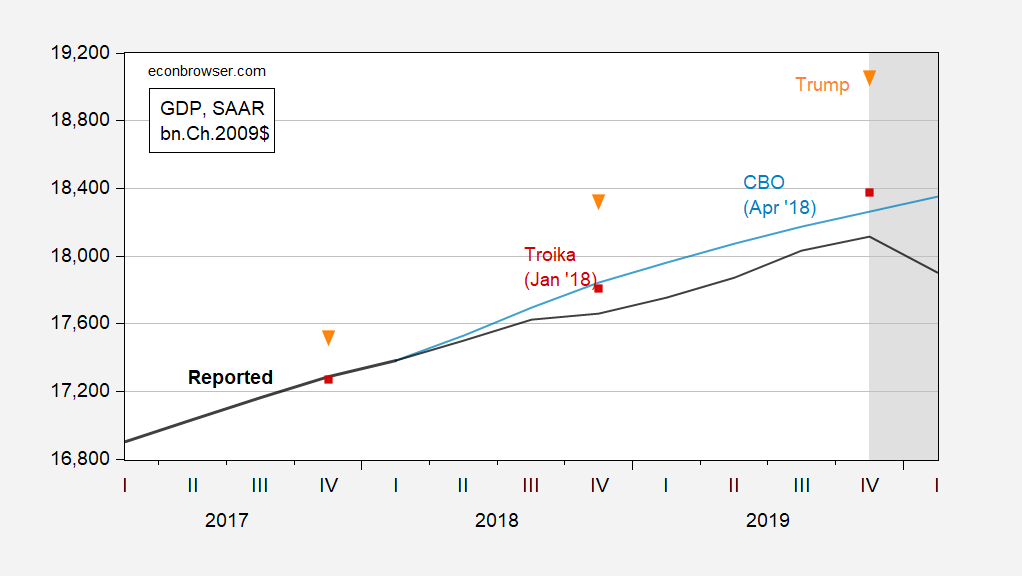
Figure 1: GDP (black), CBO (light blue), Troika/Administration (red square), Donald Trump (orange inverted triangle), all in bn.Ch.2009$ SAAR. NBER defined peak-to-trough recession dates shaded gray. Source: BEA, CBO (April 2018), Economic Report of the President, 2018, CNBC, NBER, and author’s calculations.


 Credibility Lost? Bordo-Siklos 5 Year")


